Mean-variance ceiling
Published on
Today I was playing with the count data from a small RNA-Seq experiment performed in Arabidopsis thaliana.
At some point, I decided to look at the mean-variance relationship for the fragment counts. As I said, the dataset is small; there are only 3 replicates per condition from which to estimate the variance. Moreover, each sample is from a different batch. I wasn’t expecting to see much.
But there was a pattern in the mean-variance plot that was impossible to miss.
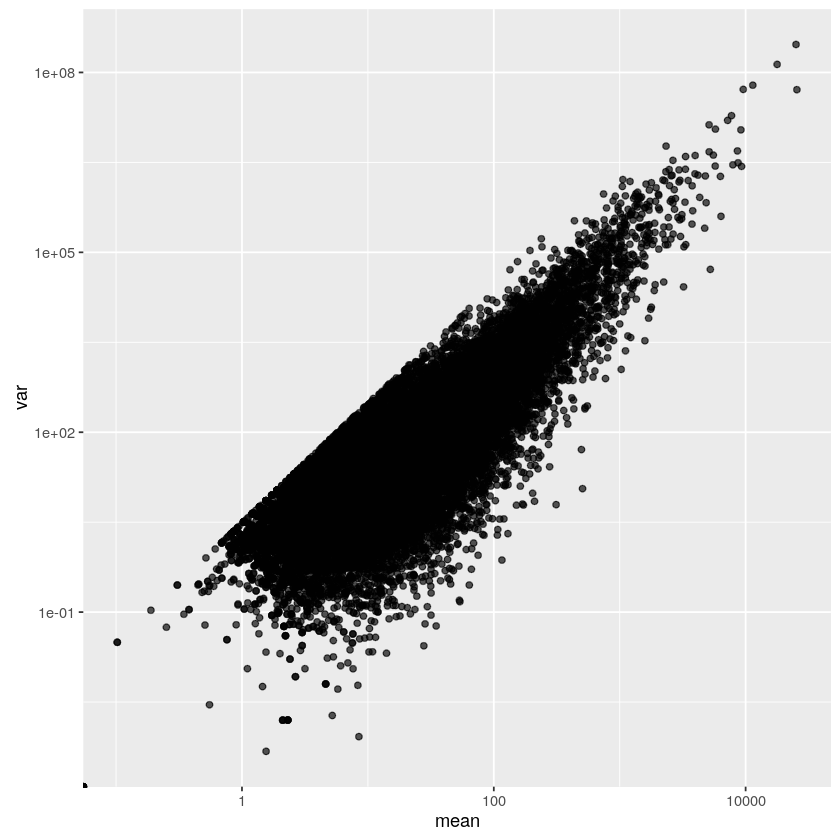
It is a nice straight line that many points lie on, but none dare to cross. A ceiling.
The ceiling looked mysterious at first, but then I found a simple explanation. The sample variance of \(n\) numbers \(a_1,\ldots,a_n\) can be written as
\[\sigma^2=\frac{n}{n-1}\left(\frac1n\sum_{i=1}^n a_i^2-\mu^2\right),\]
where \(\mu\) is the sample mean. Thus,
\[\frac{\sigma^2}{\mu^2}=\frac{\sum a_i^2}{(n-1)\mu^2}-\frac{n}{n-1}.\]
For non-negative numbers, \(n^2\mu^2=(\sum a_i)^2\geq \sum a_i^2\), and
\[\frac{\sigma^2}{\mu^2}\leq\frac{n^2}{n-1}-\frac{n}{n-1}=n.\]
This means that on a log-log plot, all points \((\mu,\sigma^2)\) lie on or below the line \(y=2x+\log n\).
Moreover, the points that lie exactly on the line correspond to the samples where all \(a_i\) but one are zero. In other words, those are gene-condition combinations where the gene’s transcripts were registered in a single replicate for that condition.