\(X\) and \(Y\) are two correlated random variables
with zero mean and equal variance. If the best way to predict \(Y\) based on \(X\) is \(y = a
x\), what is the best way to predict \(X\) based on \(Y\)?
It is not \(x = y / a\)!
Let’s find the \(a\) that minimizes
the mean squared error \(E[(Y-aX)^2]\):
Notice that the answer, the (Pearson) correlation coefficient, is
symmetric w.r.t. \(X\) and \(Y\). Thus it will be the same whether we
want to predict \(Y\) based on \(X\) or \(X\) based on \(Y\)!
How to make sense of this? It may help to consider a couple of
special cases.
First, suppose that \(X\) and \(Y\) are perfectly correlated and you’re
trying to predict \(Y\) based on \(X\). Since \(X\) is such a good predictor, just use its
value as it is (\(a=1\)).
Now, suppose that \(X\) and \(Y\) are uncorrelated. Knowing the value of
\(X\) doesn’t tell you anything about
the value of \(Y\) (as far as linear
relationships go). The best predictor you have for \(Y\) is its mean, \(0\).
Finally, suppose that \(X\) and
\(Y\) are somewhat correlated.
The correlation coefficient is the degree to which we should trust the
value of \(X\) when predicting \(Y\) versus sticking to \(0\) as a conservative estimate.
This is the key idea — to think about \(a\) in \(y=ax\) not as a degree of proportionality,
but as a degree of “trust”.
Added on 2020-08-21:
There was a related interesting discussion on twitter:
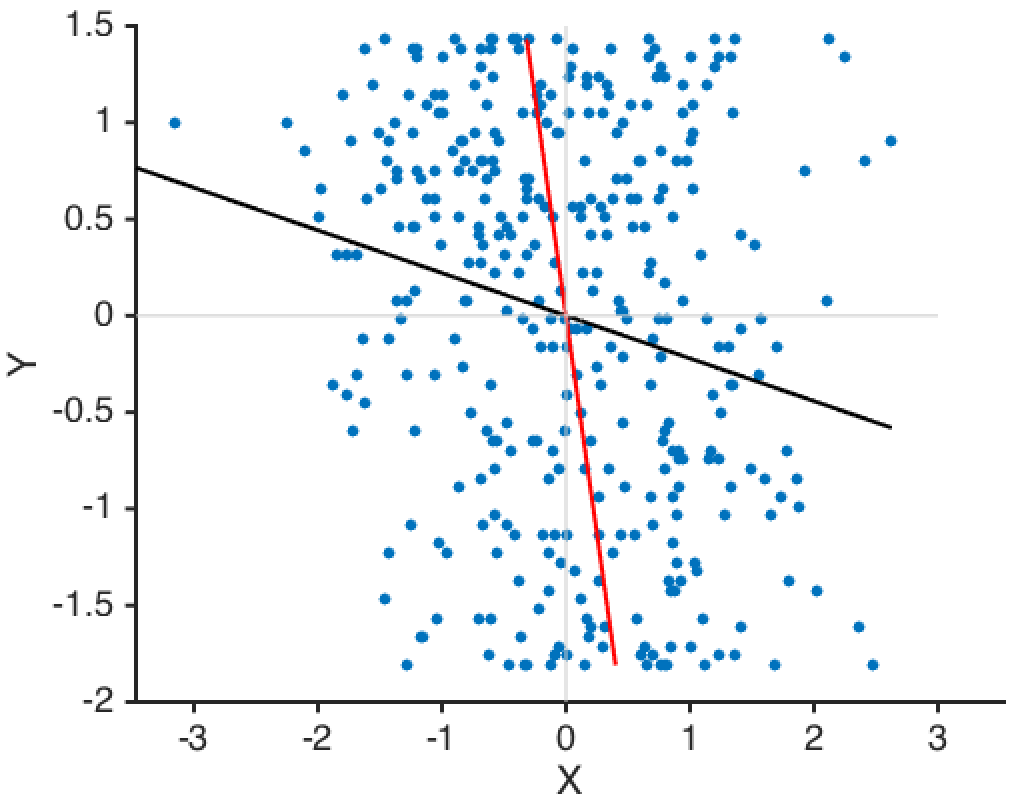
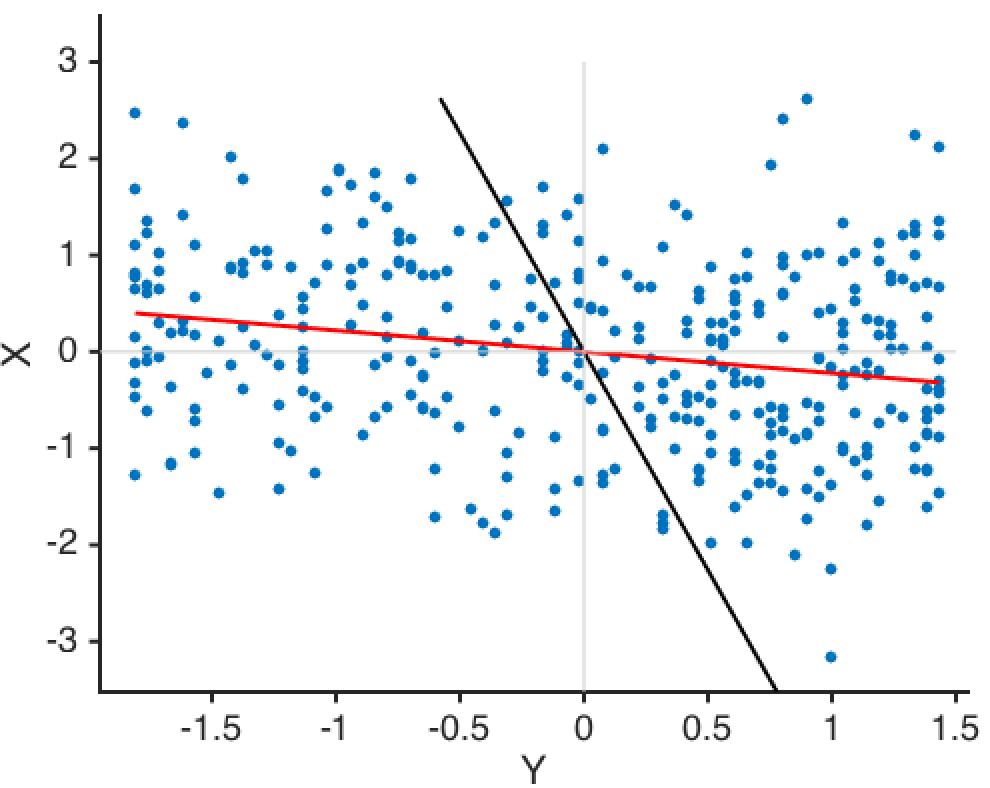
Which line do you think does a better job of predicting Y given
X? (Hint: This is one of those days where very basic statistics
confuses the hell out of me.) (1/n)
Meanwhile, the red line is better than the black line at predicting X
given Y. One explanation of the discrepancy is, predicting Y given X
assumes that there is no measurement noise in X, while predicting X
given Y assumes there is no measurement noise in Y. (3/n)
The weird thing is, you are just as good at predicting X given Y as you
are at predicting Y given X. So why does the red line look so
much better than the black line? (4/n)
By the way, both lines have zero mean and unit variance, so the slope of
each line is equal to the pearson's correlation (ρ) between X and
Y: black: Y = ρX red: X = ρY (5/n)